

On the environmental impact of artificial intelligence, video games, and social media in 2025
Study objective
Este trabajo compara, con la mejor evidencia disponible en 2025, el orden de magnitud del impacto ambiental anual de tres mercados digitales de masas —inteligencia artificial, videojuego y redes sociales— y discute si la pregunta dominante de la conversación pública sobre sostenibilidad digital (“¿qué mercado contamina más?”) está bien planteada.
The hypothesis guiding this research is that it is not. The question conflates two ontologically distinct magnitudes—intensity per unit of use and aggregate by market scale—and shifts ethical responsibility toward individual consumption when available data indicate that the decisive lever lies elsewhere: in infrastructure, product design, and regulatory frameworks.
El estudio no busca emitir un veredicto sobre cuál de los tres mercados es “el peor”. Busca algo previo: aclarar qué se está midiendo cuando se compara, qué nivel de confianza tienen los datos disponibles, y qué consecuencias éticas se derivan de la asimetría entre estos mercados.
1. Why the public conversation is misdirected
In 2025, the conversation surrounding digital sustainability has focused heavily on artificial intelligence. There are material justifications for this: it is the sector with the highest intensity per unit of compute, the fastest growth in electricity consumption within data centres, and the most robust primary evidence. The International Energy Agency maintains that AI will be the primary driver of data centre electricity growth throughout this decade, with scenarios projecting up to 945 TWh globally by 2030.
Esa concentración del debate tiene un coste analítico. Mientras se discutía si una consulta a ChatGPT consume “una botella de agua” —cifra simplificada y deficientemente documentada—, otros dos ecosistemas digitales de masas han seguido funcionando con escrutinio público desigual. Uno de ellos, el social media, muy probablemente supera a la IA en huella agregada anual de electricidad, agua y emisiones. Esto no convierte a la IA en un mercado “limpio” ni absuelve sus despliegues actuales: simplemente desplaza la pregunta.
An honest comparison requires distinguishing two factors that are routinely conflated in public discourse:
Environmental intensity per unit of use. The cost—in electricity, water, and emissions—of a specific hour, session, or query.
Aggregate annual impact by market scale. The total sum of the entire market at the end of the year, multiplying intensity by users and hours.
AI scores very high in intensity and still relatively low in aggregate, as its mass deployment is recent. Social media scores low in intensity per minute but very high in aggregate, as it totals 5.24 billion users and 894 hours of use per year for the average user. Video gaming remains in an intermediate position, with a relevant but technically more manageable footprint.
Estas tres figuras no se pueden ordenar en una “liga” sin perder información. Cada mercado tiene un perfil distinto y, sobre todo, una estructura de consumo distinta. Esa diferencia ontológica es la que hace que la pregunta inicial esté mal formulada y la que abre el problema ético al que llega este estudio.
2. Methodology and assumptions
The comparison works with three levels of evidence, explicitly prioritised.
The first category comprises direct 2025 estimates published in primary studies or reports. This primarily concerns AI, supported by recent work published in Patterns (Cell Press) which specifically estimates the global footprint of AI systems for 2025.
The second category consists of modelled sectoral estimates based on market data and observed technical parameters, which remain unaudited. This includes video games and social media. For video games, the baseline is the Lawrence Berkeley National Laboratory benchmark for the United States—34 TWh/year and 24 MtCO₂/year in 2019—cross-referenced with 2025 market size, device distribution, and measured consumption in modern consoles. For social media, the analysis draws from the digital consumption study published in Nature Communications and global usage data from DataReportal, assigning the sector a range of 12-18% of the total digital footprint per user.
El tercero son proxies y estimaciones indirectas cuando no hay dato primario sectorial 2025. Es el caso de la mayor parte del e-waste atribuible específicamente a cada uno de los tres mercados, que aparece marcado como “no especificado” donde no hay fuente primaria robusta.
This hierarchy matters. A mature public debate on digital sustainability cannot continue to treat an attributional estimate of medium-low confidence as if it were audited data. Methodological transparency is now an ethical issue, not merely a technical one.
When a study provides CO₂e but not sectoral TWh, this report applies a proxy conversion using a global average grid factor. When sectoral water data is missing, it models indirect water based on the water intensity of electricity supply. In both cases, the result must be read as an order of magnitude, not as an official inventory.
An additional, significant limitation is the asymmetry of system boundaries. AI is reasonably measurable as the operational footprint of specific systems. Video games and social media are ecosystems of mass digital consumption where user terminals, screens, networks, and, above all, usage time are critical factors. The 2025 GreenIT world study demonstrates that, within the global digital landscape, user equipment accounts for approximately 54% of global warming potential, compared to 23% for networks and 23% for data centres; in terms of total primary energy, the usage phase exceeds 80%. This explains why social media and video games can present high aggregate footprints without being as intensive per unit of compute as AI.
3. Artificial intelligence
AI is the only one of the three markets with a reasonably explicit global estimate for 2025. The cited Patterns article indicates that the electricity demand of AI systems was approximately 9.4 GW at the end of 2024, with a projection reaching 23 GW during 2025. Converted to annual energy, the approximate range is 82 to 202 TWh. The same work estimates a footprint for 2025 of 32.6 to 79.7 MtCO₂e and 312.5 to 764.6 billion litres of water.
The IEA reinforces this diagnosis from a different perspective. Data centres consumed approximately 415 TWh globally in 2024, with AI serving as the primary driver of this growth. The agency’s baseline scenario projects 945 TWh by 2030, with centres optimised for AI quadrupling their electricity consumption by that time.
There are three dominant drivers. Firstly, accelerated servers—GPUs and equivalent units—and their power density. Secondly, the associated infrastructure: cooling, uninterruptible power supply systems, and internal networks. Thirdly, the local electricity mix: the physical electricity consumed today by data centres on a global scale still relies significantly on coal and gas, although renewables and nuclear are gaining ground. The water footprint is largely indirect—associated with electricity generation—rather than direct through cooling: the study published in Nature Sustainability on AI servers in the United States estimates that indirect water accounts for 71% of the total.
The e-waste specifically attributable to AI in 2025 is not well defined. A study in Nature Computational Science projects an accumulation of 1.2 to 5.0 million tonnes of electronic waste for generative AI between 2020 and 2030; subsequent work suggests that with longer server lifespans, the high end may be moderated. The total annual mass of AI e-waste in 2025 remains unspecified in peer-reviewed primary evidence, although the trend is unequivocally upward and closely linked to the renewal of servers, accelerators, and HBM memory.
AI also possesses the most favourable potential systemic benefit profile of the three markets: electricity grid optimisation, industrial predictive maintenance, materials discovery, and the acceleration of innovation in batteries and solar photovoltaics. There is genuine technical scope for mitigation: the aforementioned Nature Sustainability study models that the combination of best practices in PUE and WUE, selective geographical location, advanced liquid cooling, and increased renewable penetration can reduce the residual carbon and water footprint by up to approximately 73% and 86% respectively by 2030 in the US.
Whether that potential materialises depends on governance, not technology.
4. Video Games
Video gaming lacks a consolidated and comparable global 2025 accounting. The most robust structural data remains the Lawrence Berkeley National Laboratory study for the United States, which estimated 34 TWh/year and 24 MtCO₂/year in 2019. Since then, the global market has grown substantially: Newzoo values the gaming market at 188.8 billion dollars in 2025, with 3.58 billion players, of whom approximately 3 billion play on mobile; mobile maintains around 55% of the sector's global expenditure.
Taking that benchmark as an anchor, adjusting for the greater global weight of mobile and adding PC, console, downloads, and a small fraction of cloud gaming, this study places the 2025 range at 110 to 190 TWh of electricity—centred around 145 TWh—, 48 to 84 MtCO₂e, and 170 to 670 billion litres of modelled indirect water. These are low-to-medium confidence figures, useful for order of magnitude.
El driver principal aquí no son los centros de datos. Son los dispositivos de usuario: consolas, gaming PCs, portátiles, móviles, pantallas y periféricos durante miles de millones de horas de uso anual. Microsoft publica baselines de potencia media global por juego de 122 W para Xbox Series X y 61 W para Series S, una transparencia inusual que permite a los estudios detectar y corregir “energy bugs” en sus motores.
The sector is the only one of the three with a mature voluntary agreement and public data. The European Game Console Voluntary Agreement (GCVA) documents reductions of up to 50% in the energy consumption of certain UHD consoles within the same generation, driven by power limits and improvements in navigation, media, and standby modes. The mitigation lever in video games lies not only in hardware but also in software and default system settings.
Sectoral e-waste for 2025 remains unspecified. The material problem is concentrated in consoles, controllers, headphones, GPUs, PCs, and screens, and the most critical pressure is likely not the final waste but the demand for metals and minerals in short renewal cycles. The GreenIT study itself underscores that the depletion of minerals and metals is already an indicator as critical as, if not more so than, CO₂ in the digital sphere.
The benefit of video gaming for sustainability is more indirect than that of AI, but not null. There are three avenues: accounting standards and best practices (Carbon Trust, Ukie, UNEP's Playing for the Planet), product efficiency (consoles, engines, and less demanding designs), and cultural mobilisation (campaigns integrated into games with hundreds of millions of players). The degree of net material savings derived from the third avenue is difficult to quantify and remains outside the scope of this study.
5. Social Media
Social media is the most difficult market to measure. Its footprint is distributed across smartphones, fixed and mobile access networks, recommendation systems, storage, and data centres—and the majority of that infrastructure is shared with other digital uses. Even so, a reasonable order of magnitude can be established.
DataReportal places the social universe in 2025 at 5.24 billion active identities, equivalent to 63.9% of the global population, with an average usage of 2 hours and 21 minutes per day. The digital consumption analysis published in Nature Communications uses an average global user with 894 hours/year of social media and an average traffic of 0.31 GB/h, within a complete digital basket that emits 229 kgCO₂e/year per average internet user. The study itself indicates that, excluding video, each non-video category contributes approximately between 10% and 18% of the total. Assigning social media a band of 12-18% of those 229 kg, the aggregate 2025 footprint stands at 144 to 216 MtCO₂e; converted via a global network proxy, this is equivalent to 325 to 490 TWh of electricity, and the modelled indirect water usage stands at 490 to 1,720 billion litres.
Here, scale outweighs intensity. Usage per person does not require the raw computing power of AI or the continuous power of high-performance gaming, but it adds up to many hours, almost always on smartphones, and mobilises networks and algorithmic recommendation on a planetary scale. The Nature Communications study itself highlights that social media is accessed via smartphone approximately 83% of the time by its archetypal user. The sustainability of the sector depends far more on terminal lifespan, network efficiency, compression, autoplay, and feed design than on the data centre in the strict sense.
The e-waste attributable exclusively to social media in 2025 remains, once again, unspecified. The primary identifiable vector is the smartphone: IDC projects between 1.25 and 1.26 billion smartphones shipped in 2025. These devices serve many functions, yet frequent phone renewal is the primary channel through which social media exerts material pressure and waste. The exact figure attributable requires a partitioning effort that does not currently exist in primary literature.
The positive side of social media for sustainability appears primarily as operational mitigation, not as a demonstrated net climate benefit for the market as a whole. The case of Meta is illustrative. In 2024, it declared 18.42 TWh of total electricity consumption—18.06 TWh in data centres—, 100% electricity matching with renewable attributes, a PUE of 1.08, a WUE of 0.19, and more than 1.6 billion gallons restored through water projects. However, the same report shows that, even with those renewable purchases, the location-based emissions of its data centres remained at 5.86 MtCO₂e and water extraction reached 4.145 billion litres. The sector can improve significantly, but its footprint remains material and cannot be rendered invisible through contractual metrics.
6. Quantitative Comparison
| Market | Electricity 2025 | Water 2025 | CO₂e 2025 | Confidence |
|---|---|---|---|---|
| AI | 82–202 TWh | 312.5–764.6 billion L | 32.6–79.7 MtCO₂e | Medium-high |
| Video game | 110–190 TWh | 170–670 billion L | 48–84 MtCO₂e | Low-medium |
| Social media | 325–490 TWh | 490–1,720 billion L | 144–216 MtCO₂e | Medium-low |
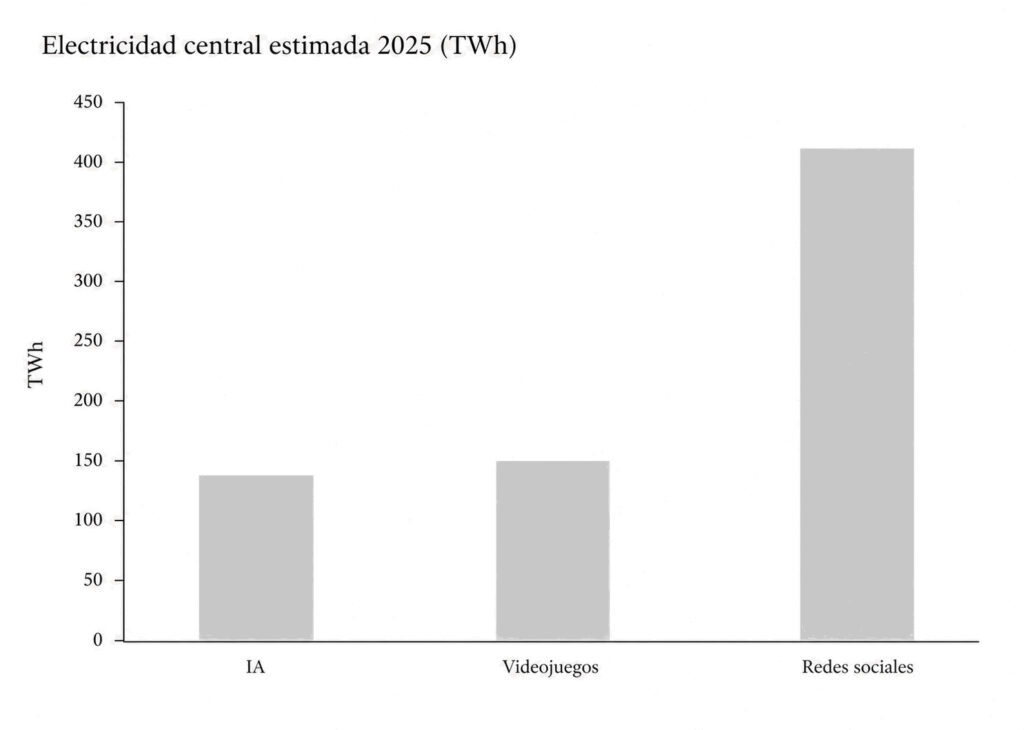
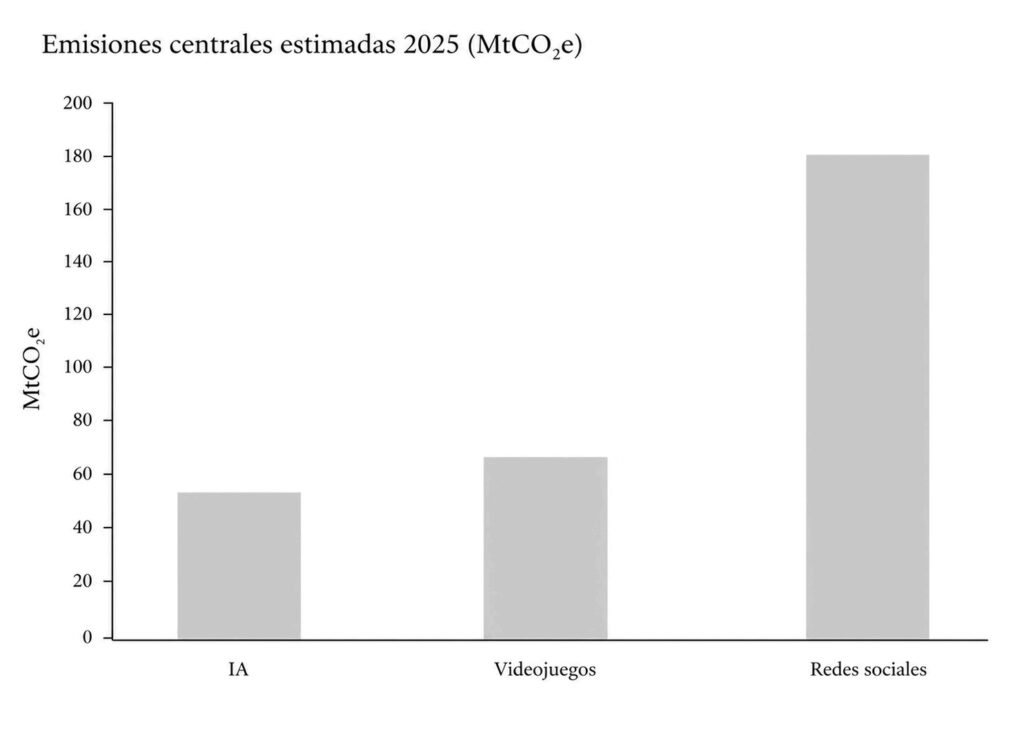
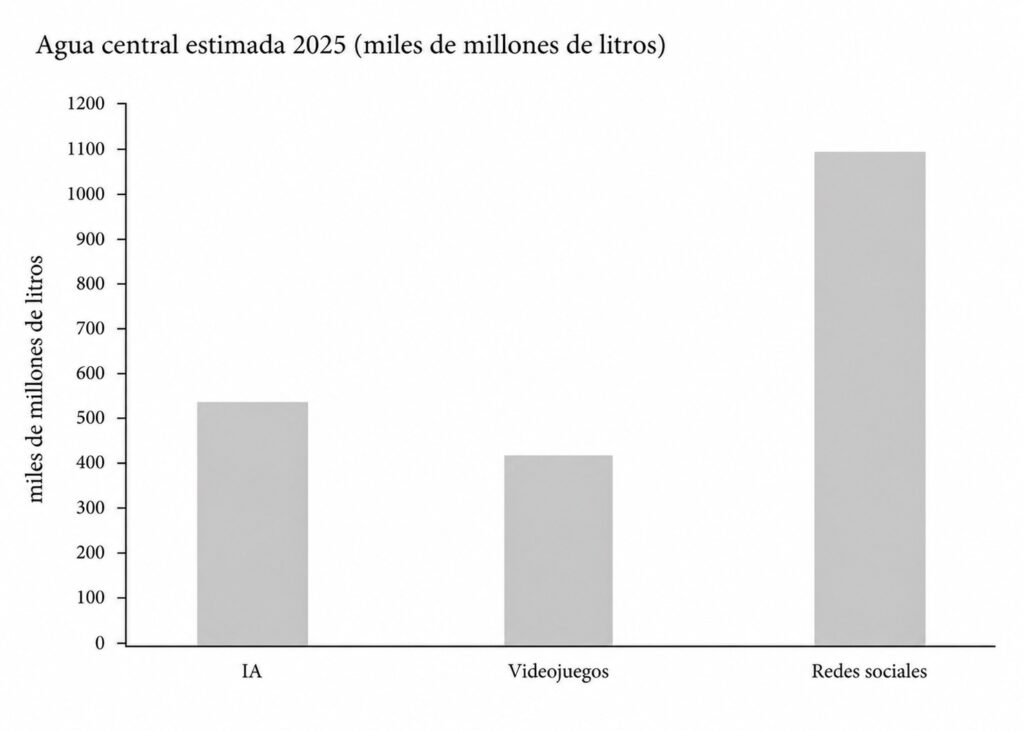
Los gráficos no deben leerse como una “liga” entre los tres mercados. Son una comparación estructural en la que cada cifra arrastra su propio nivel de confianza y su propia frontera del sistema. La razón por la que el social media aparece tan alto es la escala masiva de usuarios y horas. La razón por la que la IA aparece muy alta en intensidad pero no siempre por encima del social media en agregado es que sigue siendo un mercado menos ubicuo, aunque mucho más intensivo por unidad de cómputo.
Mirar solo el agregado y declarar al social media “el peor mercado para la sostenibilidad” es una conclusión que la evidencia disponible no soporta como afirmación robusta. Lo que sí soporta es que el social media tiene muy probablemente la mayor huella agregada anual de los tres, con un nivel de confianza media-baja, y que tres órdenes de magnitud distintos coexisten en un mismo ecosistema digital sin que las políticas públicas hayan articulado todavía una respuesta proporcional.
7. The intensity/scale asymmetry as an ethical problem
La conversación pública tiende a tratar los tres mercados como tres especies de un mismo género: “consumo digital”. Las cifras de las secciones anteriores muestran que esto es un error. No es solo que las magnitudes difieran. Es que la estructura del consumo es ontológicamente distinta en cada uno.
AI is, for now, an elective consumer market. Intensive use is concentrated among professional minorities, corporate deployments, and users with disposable income or technical curiosity. Anyone wishing to generate a thousand images with a diffusion model makes that decision consciously and separably. The footprint per user is very high, but the number of intensive users is still limited. This will likely change in the coming years, but today AI admits voluntary usage policies without grave social cost.
Social media is a structural consumer market. It is not merely that many people use networks: participation is encoded into the basic functioning of the contemporary economy, public administration, affective mediation, and family support networks. Public administrations communicate via X. Companies select candidates via LinkedIn. Families coordinate via WhatsApp and Facebook groups. Liberal professionals acquire clients via Instagram. The vast majority of the 5.24 billion users cannot opt out without paying a disproportionate social, professional, affective, or administrative cost.
Video gaming is in between. It is partially elective—no one is obliged to play—but it is also culturally normalised and widely integrated into the social lives of several generations. Its average use per person is significant, though not comparable to that of social media.
Esta distinción tiene consecuencias éticas serias. La pregunta “¿cuál es un consumo digital ético?” significa cosas distintas según la estructura del mercado. No se puede pedir a un usuario individual que reduzca su consumo de social media en la misma clave en que se le pide que reduzca su consumo de carne, sus viajes en avión o su uso de IA generativa para generar memes. La participación en redes sociales no es un consumo elegible en el sentido en que lo es una sesión de Stable Diffusion o una partida de Cyberpunk 2077.
Esto no exime al usuario de ningún juicio, pero desplaza el centro del juicio. La pregunta deja de ser “¿qué consumes?” y pasa a ser “¿en qué condiciones se ofrece el consumo y quién decide esas condiciones?”.
8. Ethical consumption in structural markets
La distinción entre mercado electivo y mercado estructural tiene consecuencias para el discurso ético dominante sobre sostenibilidad digital, que tiende a moralizar al usuario individual. En IA, donde el consumo es relativamente electivo, la pregunta “¿debes generar imágenes con IA solo para diversión?” tiene sentido. En social media, donde el consumo es estructural, la pregunta análoga (“¿debes usar redes sociales?”) es vacía: la mayoría no puede dejar de hacerlo sin pagar un coste desproporcionado.
This does not mean the user lacks agency. Real individual levers are concentrated in four points:
- Extending the service life of the smartphone, which is the primary material vector of social media.
- Limiting autoplay, background video, and default notifications.
- Choosing Wi-Fi over mobile data when possible, due to the difference in energy efficiency between networks.
- Reducing the consumption of non-essential video.
These levers are real but marginal compared to the structural levers, which lie in product design. If the feed is served with autoplay activated by default and the user must opt-out, the aggregate behaviour will be high-intensity video traffic. If smartphones are designed for 18–24 month lifecycles with increasing difficulty in replacing batteries and repairing screens, the aggregate will be smartphones renewed every 18–24 months. If the default quality of uploaded video is 1080p or 4K regardless of context, the aggregate will be high-quality video traffic even when the user’s screen does not benefit from it.
La ética del consumo digital no puede plantearse como ética individual sin caer en lo que el filósofo Hans Jonas llamó “el principio de responsabilidad” mal aplicado: cargar al individuo con la responsabilidad de un sistema cuyo diseño no controla. La carga moral no es simétrica entre usuarios, diseñadores de producto, plataformas y reguladores.
9. Infrastructural responsibility
This is not an argument in favour of absolving the user and demonising platforms. It is an analytical clarification: in structural and mass consumer markets, the decisive lever lies in the infrastructure. And that infrastructure has identifiable parties responsible at three levels.
Product design. Those who define the defaults define the aggregate behaviour. Autoplay, default video quality, frequency of forced updates, the hardware's planned obsolescence cycle, and notification defaults. These decisions are made within product teams whose metrics are engagement, retention, and conversion, not environmental impact.
Business model. When the business is attention and that attention is monetised through exposure to advertisements, the structural incentive pushes towards more time, more video, more traffic, and more hardware renewal. The environmental footprint is an externality not accounted for in the balance sheets of most dominant platforms. As long as this remains unchanged, marginal improvements in technical efficiency—a lower PUE, more efficient compression—will be offset and surpassed by the growth in usage.
Regulatory frameworks. These are the points where collective ethics can operate with a real, aggregate effect:
- Mandatory disclosure standards for energy, water, PUE, WUE, and emissions per AI workload, not merely at an aggregate corporate level.
- Minimum requirements for the repairability and service life of smartphones, in line with what the European Right to Repair Directive is beginning to articulate.
- Restrictions on the deployment of data centres in basins with documented water stress.
- Obligation for additional renewable capacity—not merely contractual matching—associated with the growth of data centre loads.
- Regulación de defaults agresivos de autoplay y notificaciones, en línea con las primeras propuestas que ya circulan sobre “design defaults” en el ámbito de la salud mental digital y la atención.
- Penalisation of the deployment of AI with low social value when the energy and water costs are disproportionate.
For video games, the four most effective levers are matters of public governance: extending hardware service life through mandatory repairability, expanding GCVA-type standards to further markets, incorporating energy consumption metrics into toolchains and publishing certifications, and mandating low-power modes that are active by default. This is the sector with the greatest scope for immediate technical improvements at the lowest social cost.
Digital sustainability will not be resolved by the sum of better individual choices. It will be resolved—if it is resolved at all—through infrastructural interventions at the three levels mentioned above.
10. Limitations of the study
The main limitation is sectoral transparency. For AI, specific 2025 studies already exist, but granular disclosure by company and workload remains lacking. For video games and social media, the problem is greater: there is no global, audited, and homogeneous account of the 2025 market that clearly separates hardware, software, networks, and end-use. In these two markets, the figures in this study should be read as plausible ranges, not as official inventories.
The system boundary between markets is asymmetrical. AI is reasonably measured as an operational compute footprint. Video games and social media are ecosystems of mass digital consumption where the user terminal carries significant weight. Absolute comparability between rows is not perfect.
The e-waste attributable to each market in 2025 remains largely unspecified in primary evidence. The figures provided in this study for 2025 are aggregated and approximate, not audited.
This study maintains that these limitations do not invalidate the primary argument—the asymmetry of intensity versus scale and infrastructural responsibility—because that argument operates on structures of consumption rather than exact figures. What the figures establish is the relative order of magnitude. What the ethical argument demands does not follow from a tenth of a percentage point more or less within a confidence interval, but from the qualitative fact that three distinct orders of magnitude coexist within the same ecosystem with three distinct structures of consumption.
11. Conclusion
Three conclusions are derived from the analysis.
The first is descriptive. AI has the highest intensity per unit of use and, currently, a significant aggregate footprint that remains below that of social media. Social media most likely has the highest annual aggregate footprint and the lowest demonstrated potential for net savings within its own market. Video games fall in the middle, with the most technically addressable footprint and the most mature sectoral standards.
La segunda es metodológica. La pregunta “¿cuál es el peor de los tres?” está mal planteada. Cada mercado tiene una estructura de consumo distinta —electiva en IA, estructural en social media, intermedia en videojuego— y demanda respuestas éticas distintas. Tratar a los tres como equivalentes morales conduce a falsos consensos, a la moralización vacía del usuario y a políticas públicas que culpabilizan al lado más débil de la ecuación.
The third is ethical. Responsibility for digital sustainability in 2025 is not an individual matter. It is a matter of product design, business model, and regulation. Individual levers exist, but they are marginal compared to the decisions made by those who design, finance, and regulate these infrastructures. While public debate remains focused on whether the user should use ChatGPT less, the decisions that truly move the needle—hardware lifecycles, product defaults, data centre location, regulation of attention-based business models—continue to be made far from public scrutiny.
Author's position
This study is not presented as a neutral exercise. The signatory works professionally with digital technologies: they employ video games and artificial intelligence as tools in their experimental practice of artistic and social processes, register works on the blockchain when the nature of the work requires it, distribute on decentralised networks, and are an active user of the social networks identified here as the market with the largest aggregate footprint. This position does not place me outside the described problem. It places me within it.
The ethical position consistent with the analysed data is not technological abstinence—which would be ineffective and individually costly—nor is it uncritical adoption. It is to demand radical transparency, common standards for measurement and reduction, and responsible infrastructural design from those who possess the power and the data to produce them. The public conversation on digital sustainability has spent too much time blaming the user for consuming and too little time asking why the system is designed so that such consumption is inevitable, opaque, and difficult to measure.
Sources
[1] International Energy Agency (IEA). Energy and AI, 2025. https://www.iea.org/reports/energy-and-ai
[2] International Energy Agency (IEA). Energy demand from AI, 2025. https://www.iea.org/reports/energy-and-ai/energy-demand-from-ai
[3] Patterns (Cell Press). “The carbon and water footprints of data centers and what this could mean for artificial intelligence”, 2025. https://www.sciencedirect.com/science/article/pii/S2666389925002788
[4] Nature Sustainability, “Environmental footprint of AI servers”, 2025. https://www.nature.com/articles/s41893-025-01681-y
[5] Nature Computational Science. “E-waste from generative AI”, 2024. https://www.nature.com/articles/s43588-024-00712-6
[6] Mills, E. & Mills, N., Lawrence Berkeley National Laboratory. “Taming the energy use of gaming computers”, Energy Efficiency / Computer Games Journal, 2019. https://link.springer.com/article/10.1007/s40869-019-00084-2
[7] Microsoft. Global platform baselines for Xbox, 2024. https://learn.microsoft.com/en-us/gaming/sustainability/global-platform-baselines
[8] Game Console Voluntary Agreement (GCVA). 2023 Review Report. https://efficientgaming.info/wp-content/uploads/documents/Agreements/2023_GCVA_Review_Report_FINAL.pdf
[9] UNEP / Playing for the Planet. Annual Impact Report 2024. https://www.unep.org/resources/report/playing-planet-annual-impact-report-2024
[10] DataReportal. Digital 2025: Global Overview Report. https://datareportal.com/reports/digital-2025-global-overview-report
[11] Nature Communications. “The environmental footprint of digital consumption”, 2024. https://www.nature.com/articles/s41467-024-47621-w
[12] GreenIT.fr. World Study 2025: Environmental impacts of digital technology worldwide. https://greenit.eco/wp-content/uploads/2025/05/greenit-world-study-2025-20250417.pdf
[13] IDC. Worldwide Smartphone Tracker, 2025. https://my.idc.com/getdoc.jsp?containerId=prUS53965725
[14] Meta. 2025 Sustainability Environmental Data Index (2024 data). https://sustainability.atmeta.com/wp-content/uploads/2025/10/Meta_2025-Environmental-Data-Index.pdf
[15] IEA. AI is set to drive surging electricity demand from data centres, 2025. https://www.iea.org/news/ai-is-set-to-drive-surging-electricity-demand-from-data-centres-while-offering-the-potential-to-transform-how-the-energy-sector-works
Update note
A more concise journalistic version of this study, adapted for a general audience, was published in eldiario.es under the title The problem of ethical digital consumption extends beyond AI. Available at: https://www.eldiario.es/opinionsocios/problema-consumo-digital-etico-ia_132_13232659.html
Series · Infrastructures
This piece forms part of a six-part series examining the influence of digital and cultural systems upon art. The overarching thesis posits that within contemporary systems, the decisive factor is not individual conduct but rather infrastructural design. The series commences with the capture mechanisms of these systems and concludes with their exclusionary practices.